September’s housing numbers show why East Bay real estate is best understood city by city. Fremont, Union City, Hayward, and Newark are all in Alameda County, yet their September 2026 results moved in noticeably different directions.
The California Association of REALTORS® (C.A.R.) reports below cover existing single-family detached homes. They do not include every condo, townhome, or new-construction sale. The figures are useful for spotting broad conditions, but a buyer or seller should still rely on recent comparable sales for the specific neighborhood and property type.
September 2026 at a glance
| City | Home sales | Median price | Active listings | Median days | Sale-to-list | Price reductions |
|---|---|---|---|---|---|---|
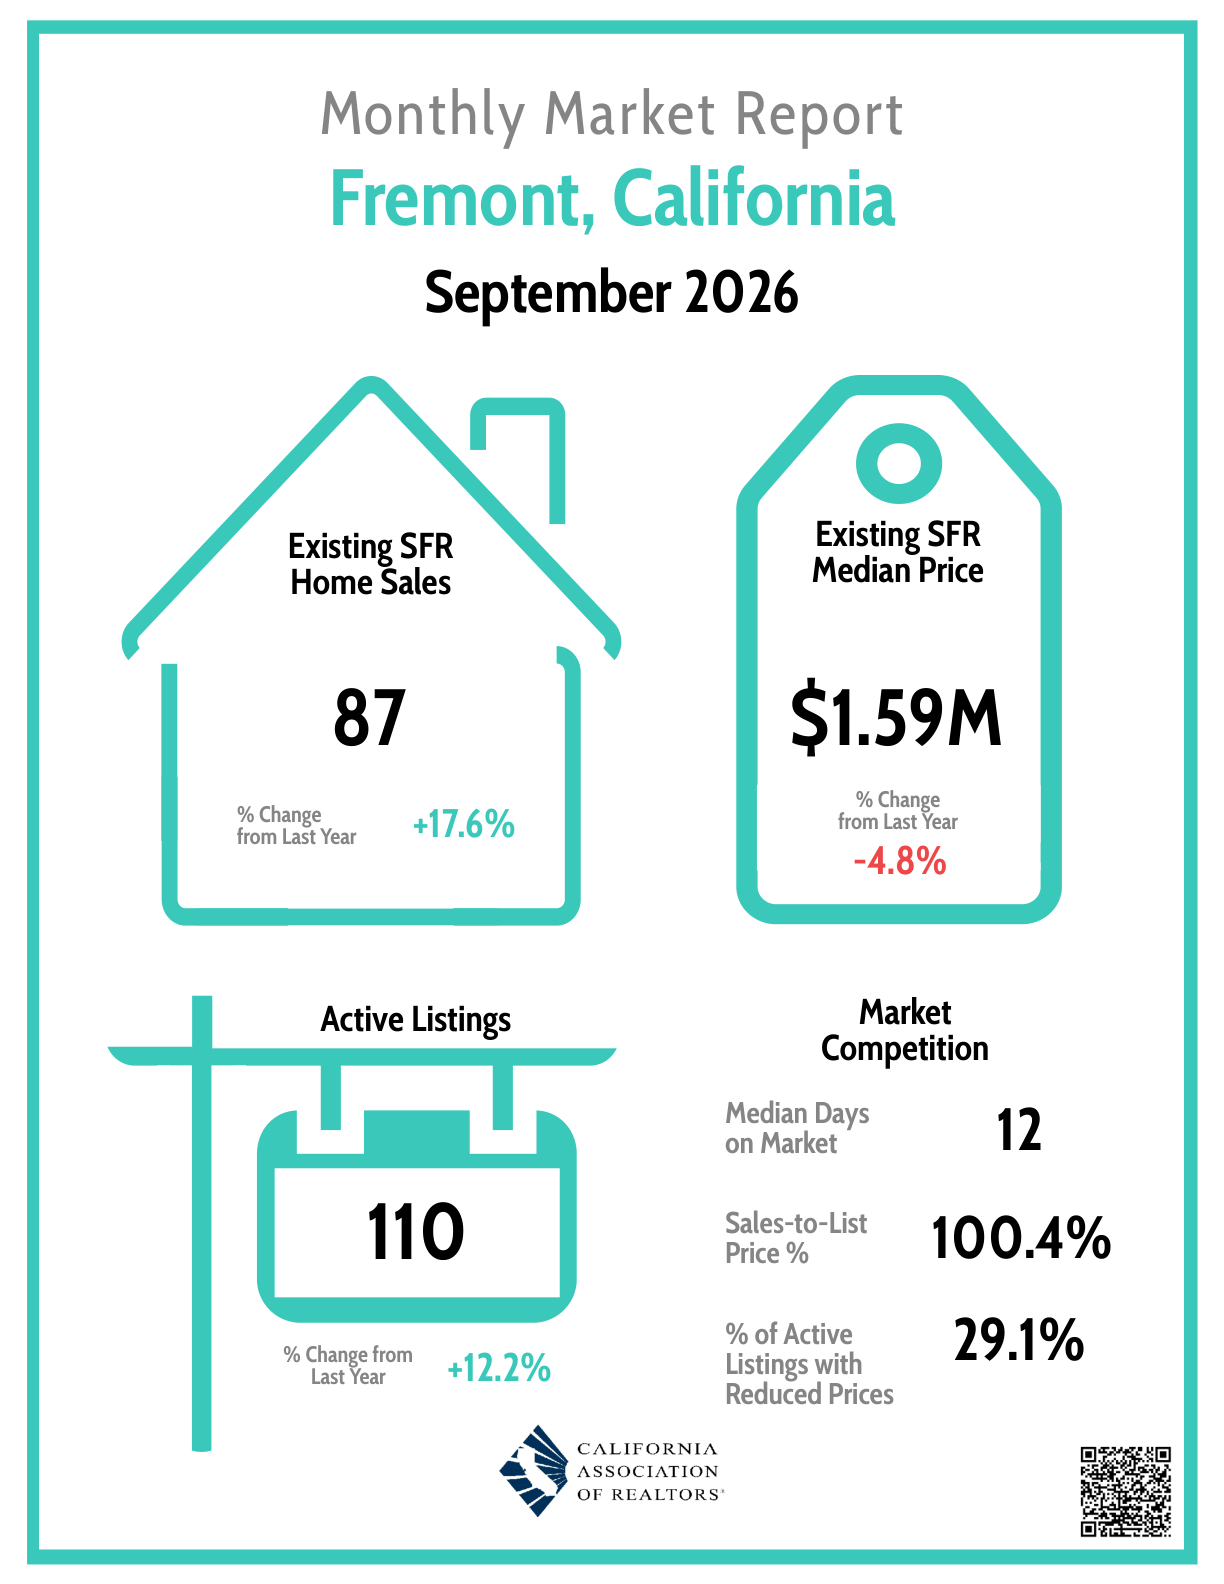
| Fremont | 87 (+17.6% YoY) | $1.59M (-4.8%) | 110 (+12.2%) | 12 | 100.4% | 29.1% |
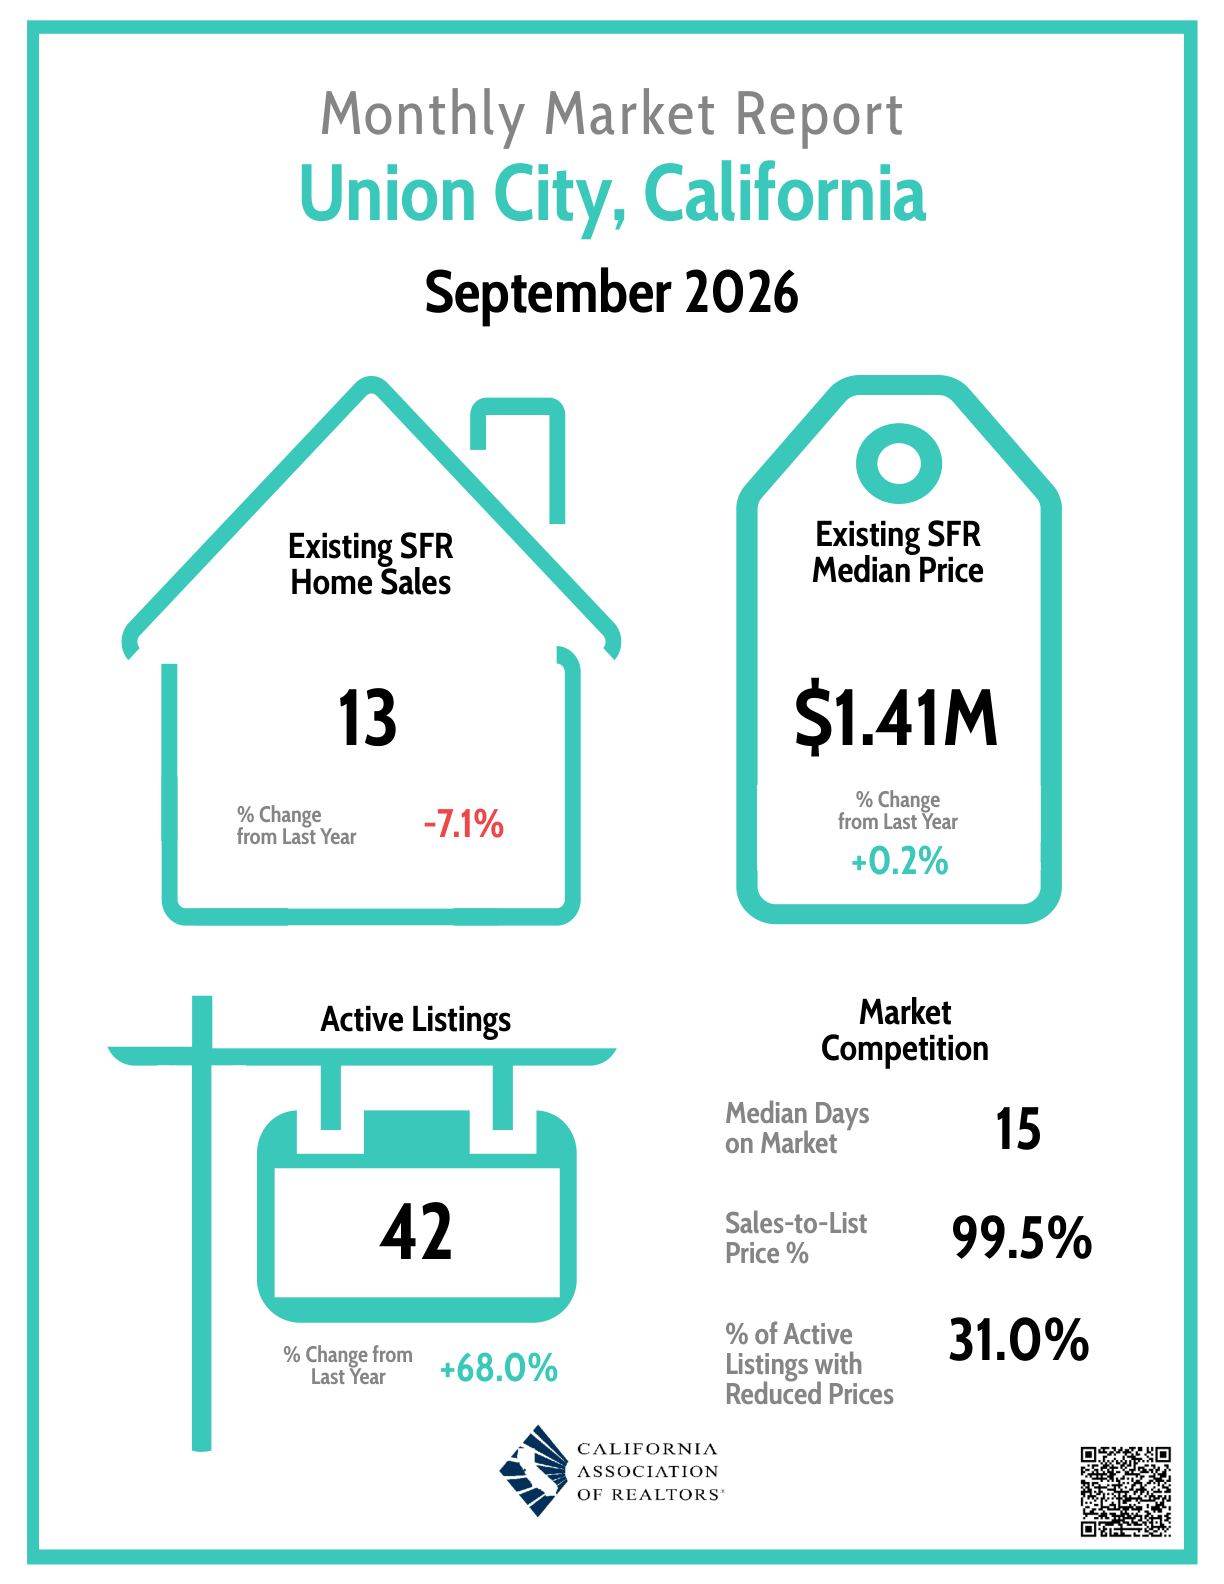
| Union City | 13 (-7.1% YoY) | $1.41M (+0.2%) | 42 (+68.0%) | 15 | 99.5% | 31.0% |
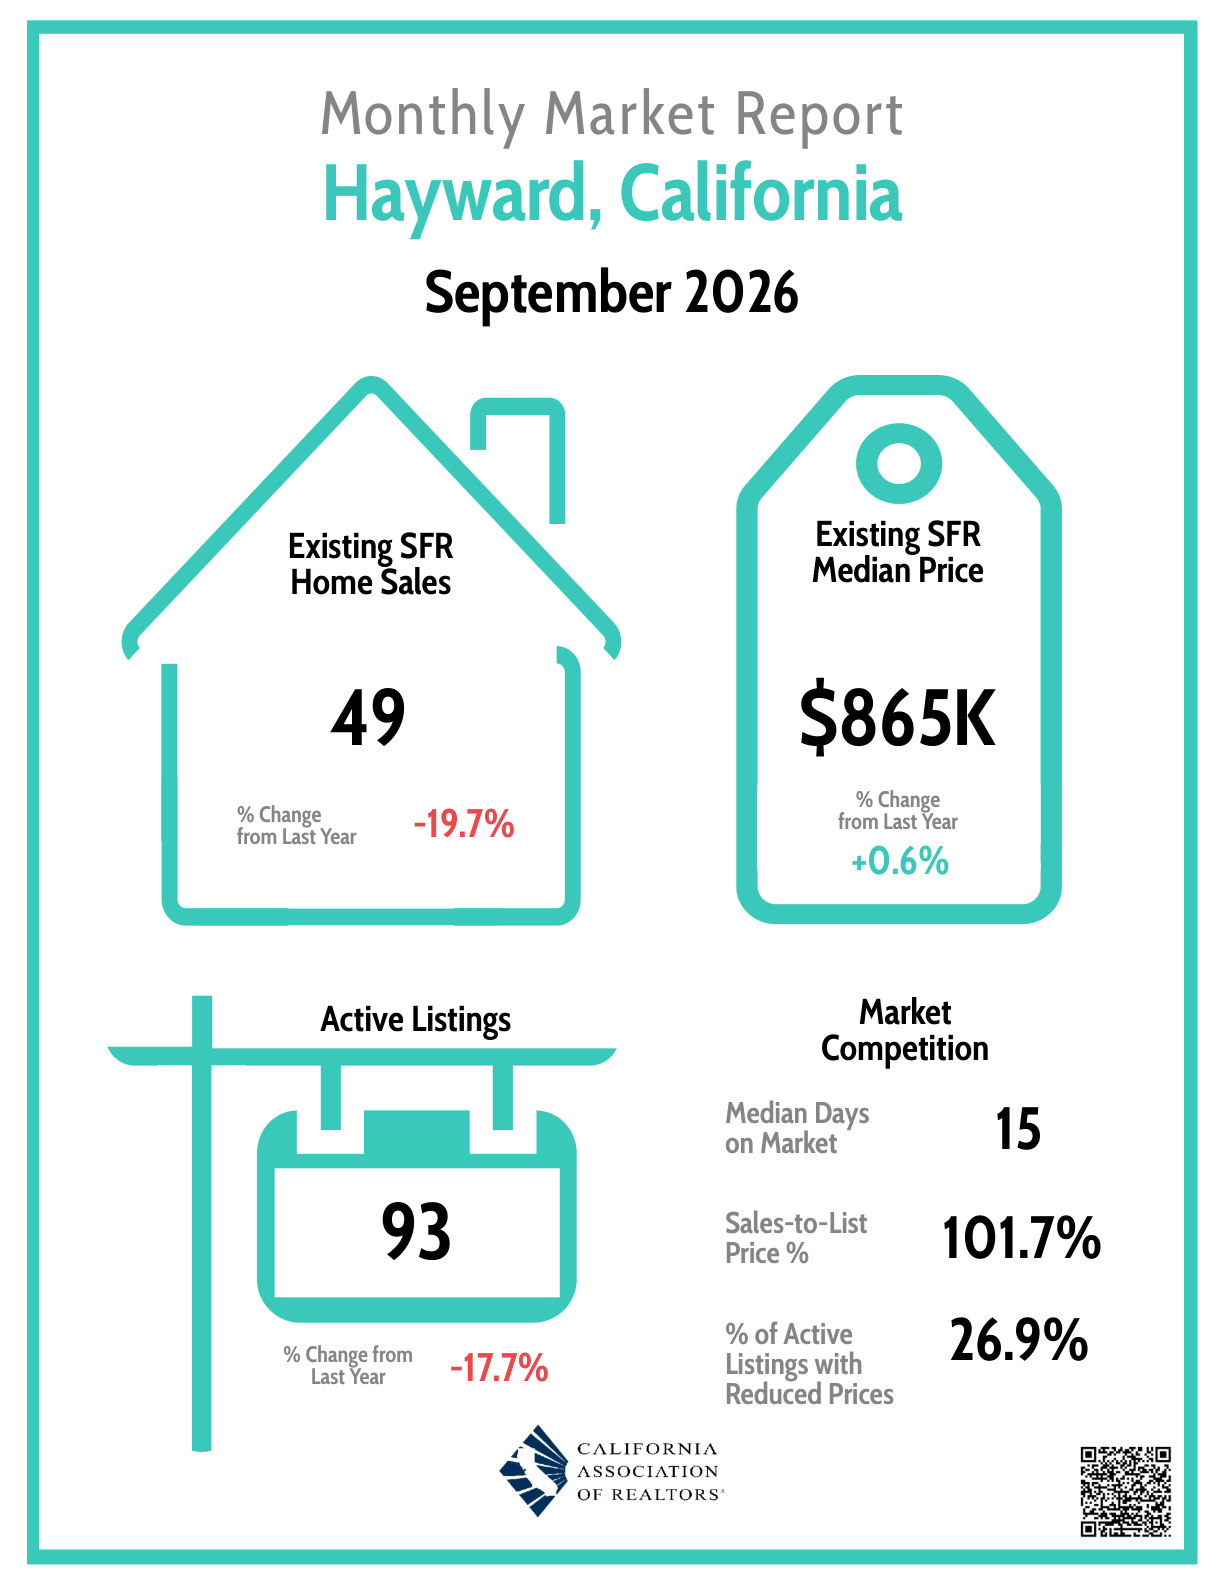
| Hayward | 49 (-19.7% YoY) | $865K (+0.6%) | 93 (-17.7%) | 15 | 101.7% | 26.9% |
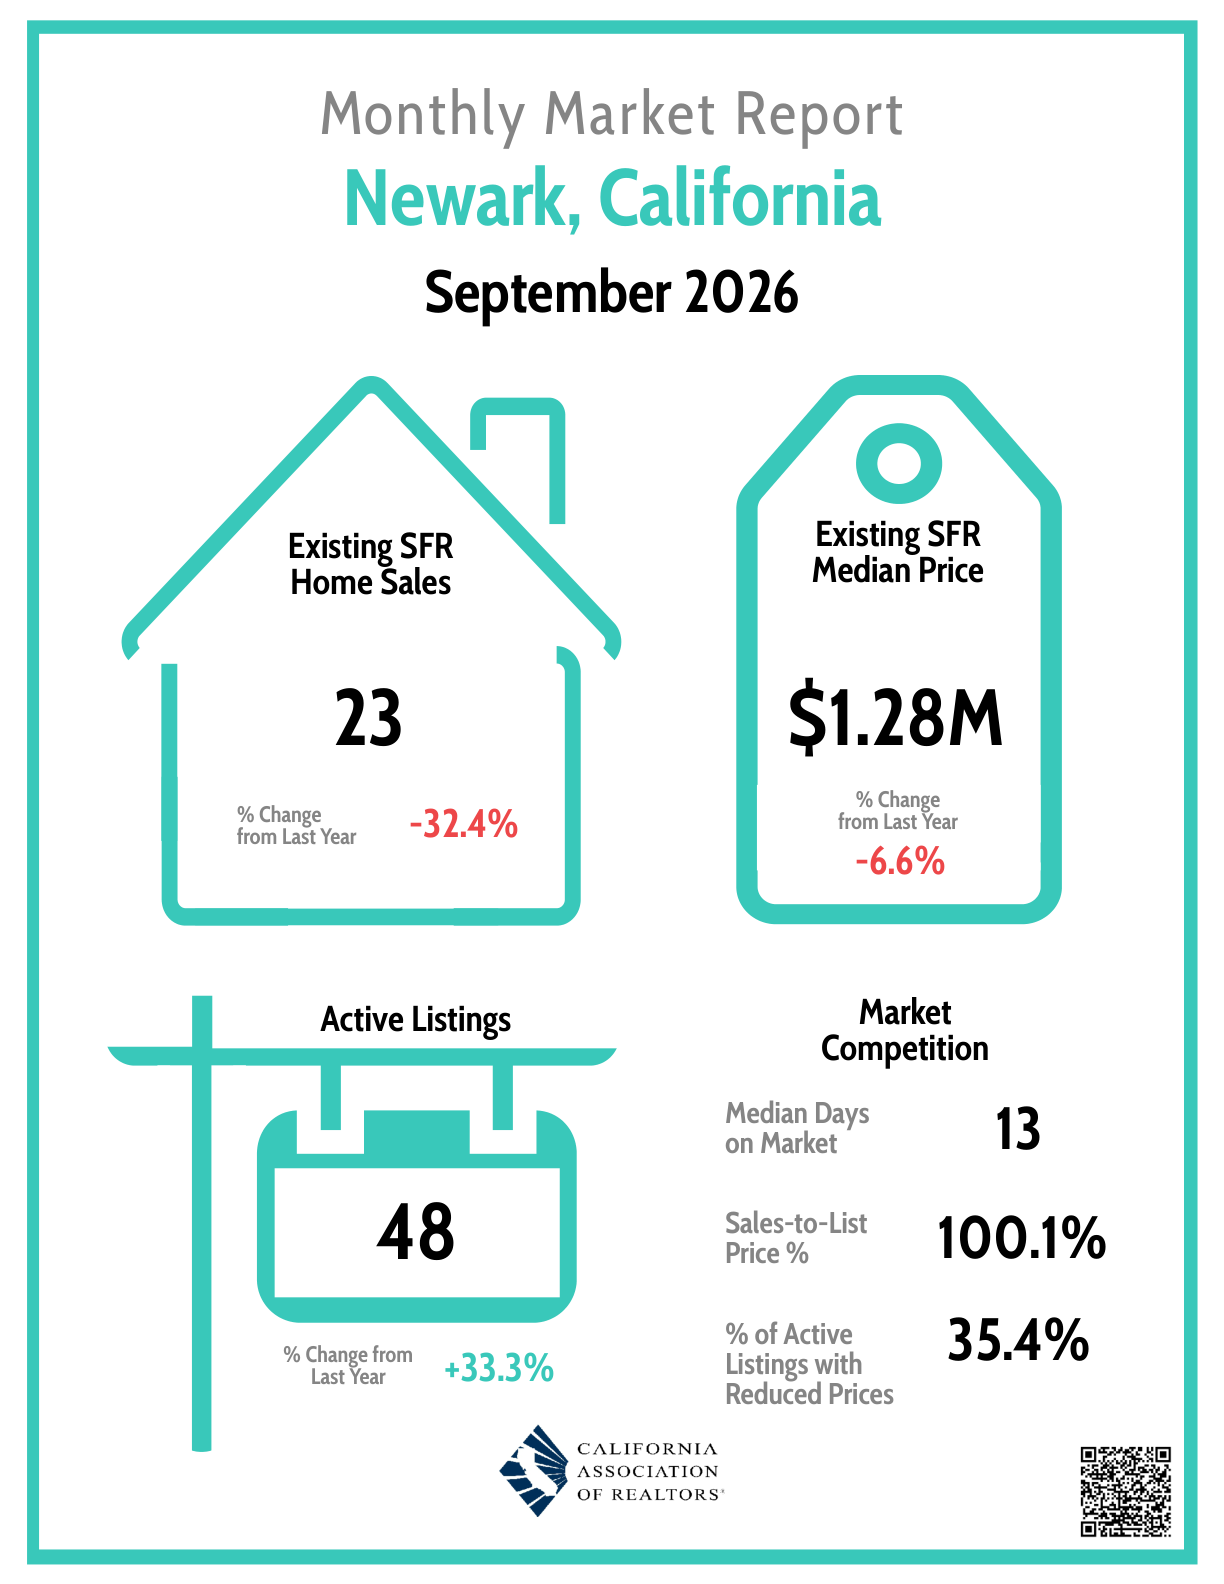
| Newark | 23 (-32.4% YoY) | $1.28M (-6.6%) | 48 (+33.3%) | 13 | 100.1% | 35.4% |
Year-over-year percentages compare September 2026 with September 2025. Median price is not the same as an estimate of how much an individual home gained or lost in value.
Fremont: more sales and more choice
Fremont recorded 87 existing single-family home sales, up 17.6% from a year earlier. Active listings reached 110, an increase of 12.2%. That combination suggests buyers had more choices than last September, while completed sales also improved.
The median sale price was $1.59 million, down 4.8% year over year. Homes that sold moved quickly, with a median of 12 days on the market, and the sale-to-list ratio was 100.4%. At the same time, 29.1% of active listings had reduced their asking price. In practical terms, well-positioned homes could still attract strong offers, but buyers were not treating every listing the same way.
Union City: inventory rose sharply
Union City had 13 existing single-family home sales in September, 7.1% fewer than a year earlier. Active listings increased 68.0% to 42. Because the sales count is small, one month should not be treated as a complete trend. Still, the rise in available listings is important for buyers who had been waiting for more options.
The median price was $1.41 million, almost unchanged from last year at +0.2%. The typical sold home spent 15 days on the market, and sellers received 99.5% of list price on average. With 31.0% of active listings showing a price reduction, pricing and condition appear to have mattered even though the median price itself remained steady.
Hayward: fewer listings, but strong sale-to-list results
Hayward reported 49 sales, down 19.7% year over year. Active listings also declined, falling 17.7% to 93. The median price was $865,000, up a modest 0.6% from September 2025.
The median time on market was 15 days, while the sale-to-list ratio reached 101.7%—the highest of the four cities in this comparison. That does not mean every home sold above asking. It means the group of homes that closed produced that overall ratio. Meanwhile, 26.9% of active listings had reduced prices, another reminder that presentation, location, condition, and starting price can produce very different outcomes within the same city.
Newark: slower sales volume and more price adjustments
Newark closed 23 existing single-family home sales, down 32.4% from a year earlier. Active listings increased 33.3% to 48. The median price was $1.28 million, 6.6% below September 2025.
Homes that sold still moved in a median of 13 days, and the sale-to-list ratio was 100.1%. However, 35.4% of active listings had a price reduction—the highest share among these four cities. Sellers should pay attention to that split: the market could reward the right home at the right price while forcing other listings to adjust after launch.
What buyers can take from the numbers
- More inventory can create options, not automatic bargains. Union City and Newark had sizable year-over-year listing increases, but desirable homes could still sell quickly.
- Use city data as a starting point. A neighborhood, school boundary, home condition, lot, and property type can matter more than the citywide median.
- Watch pricing history. The share of reduced listings ranged from 26.9% to 35.4%, so buyers should review how long a home has been listed and whether the price has already changed.
If you are comparing locations, our Bay Area communities guide provides a practical overview of Fremont, Union City, Newark, and Hayward. You may also find our comparison of Fremont and Union City useful.
What sellers can take from the numbers
Fast median market times and sale-to-list ratios near or above 100% show that buyers were still active. But the price-reduction percentages show that a strong market response was not guaranteed. Sellers should compare their home with recent nearby sales and current competition, then choose a launch price that reflects condition, location, and likely buyer demand.
A citywide median cannot set the price of a particular home. For a property-specific review, start with a local home-value consultation and a comparative market analysis using the most relevant recent sales.
The bottom line
September 2026 was not one uniform Alameda County market. Fremont saw higher sales and inventory, Union City had a major increase in available listings, Hayward’s closed sales achieved the strongest sale-to-list ratio, and Newark showed the largest decline in sales volume along with the highest share of price reductions.
For buyers, the month offered signs of choice and selective negotiating room. For sellers, it reinforced the importance of preparation and accurate pricing. The most useful next step is to connect these citywide figures to the exact neighborhood and home type involved.
Original sources:
- California Association of REALTORS® — Housing Market Overview (September 2026 city reports; accessed October 29, 2026).
- C.A.R. — Fremont Monthly Market Report, September 2026.
- C.A.R. — Union City Monthly Market Report, September 2026.
- C.A.R. — Hayward Monthly Market Report, September 2026.
- C.A.R. — Newark Monthly Market Report, September 2026.
C.A.R. notes that these figures come from a survey of REALTOR® associations and represent existing single-family detached homes. The data are not seasonally adjusted, and changes in the median can reflect changes in the mix of homes sold. This article is general market information, not a valuation, investment recommendation, or prediction.